

Championing equality through evidence, analysis and action
SSI’s Impact Strategy articulates our longer-term impact. A key strategic goal is to influence change through research, advocacy and policy contributions with a focus on shifting the dial to unleash the economic potential of refugees and migrants.
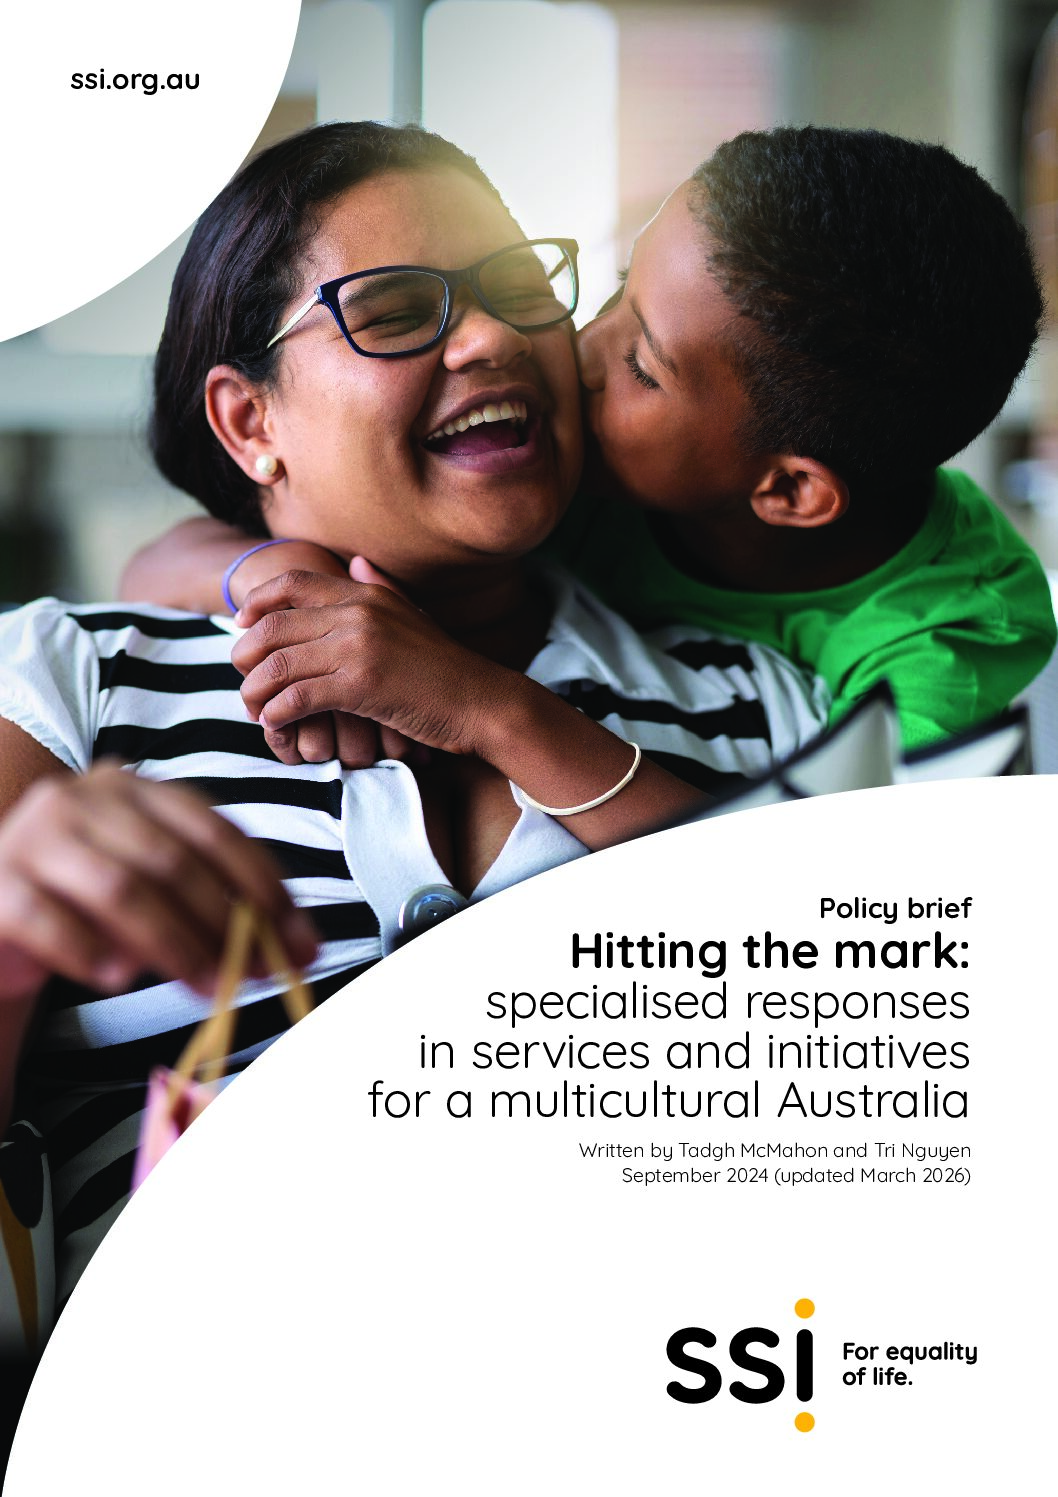
Our Research Insights deepen understanding of the strengths and challenges that individuals and communities face and what’s needed to address barriers to equality.
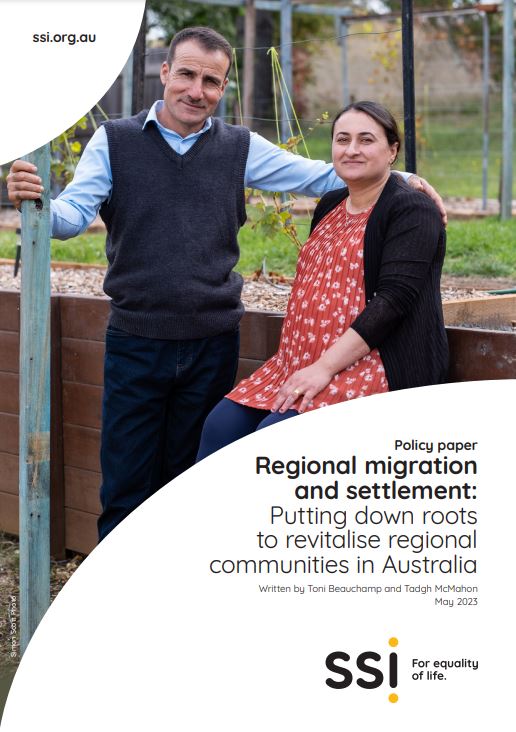
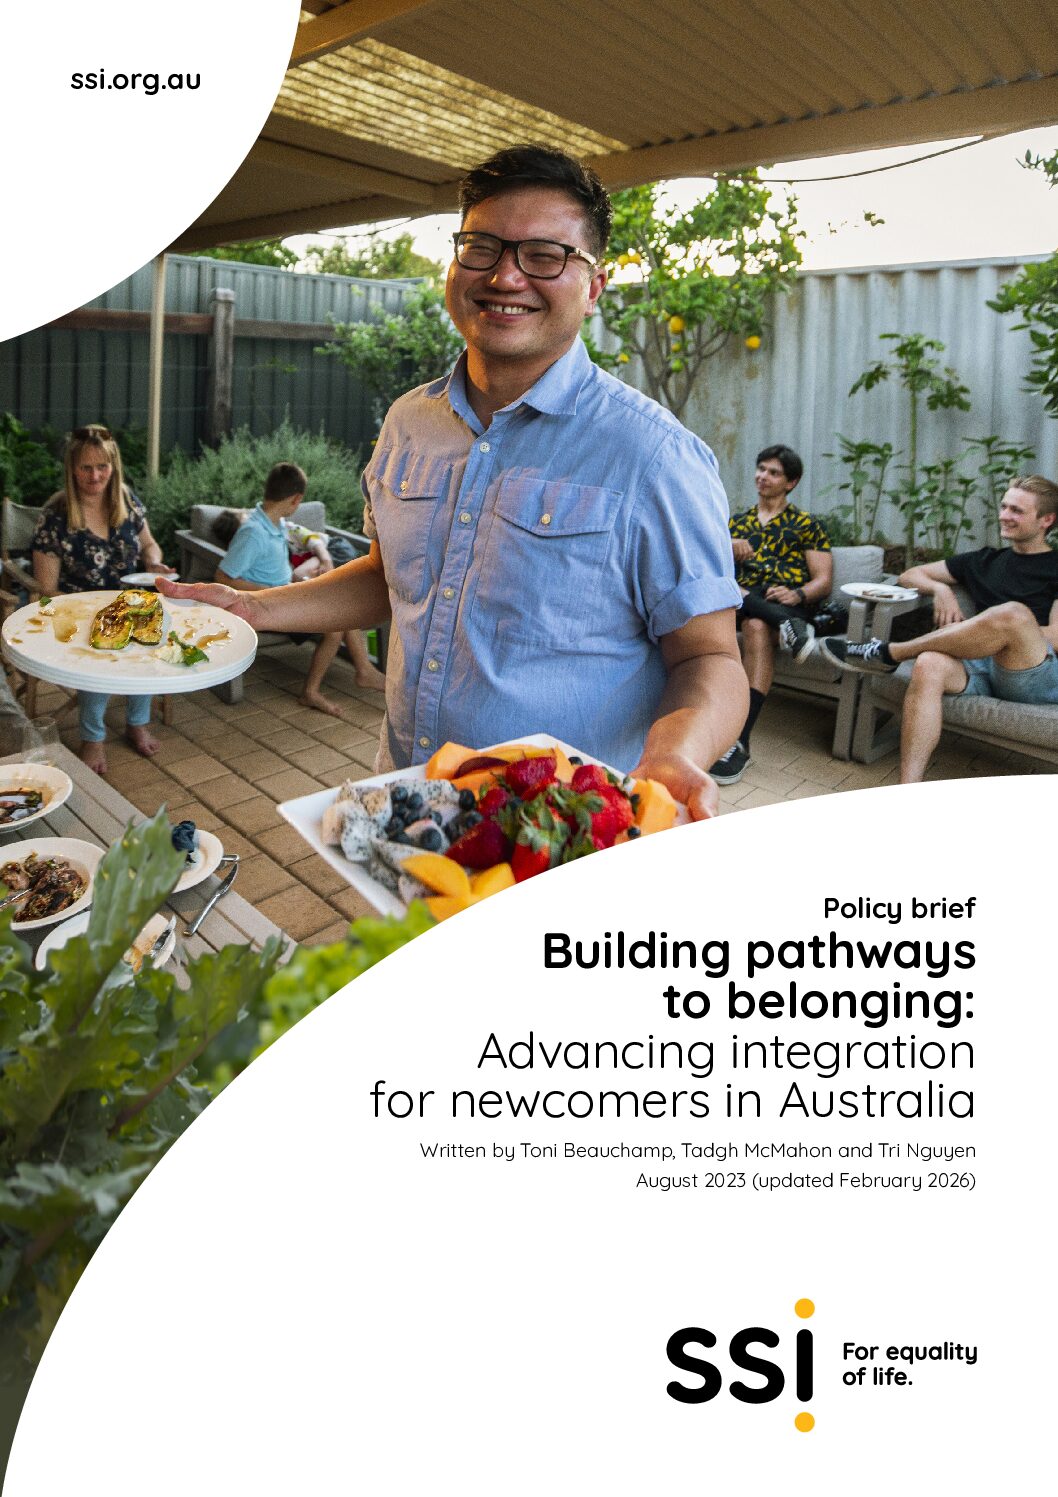
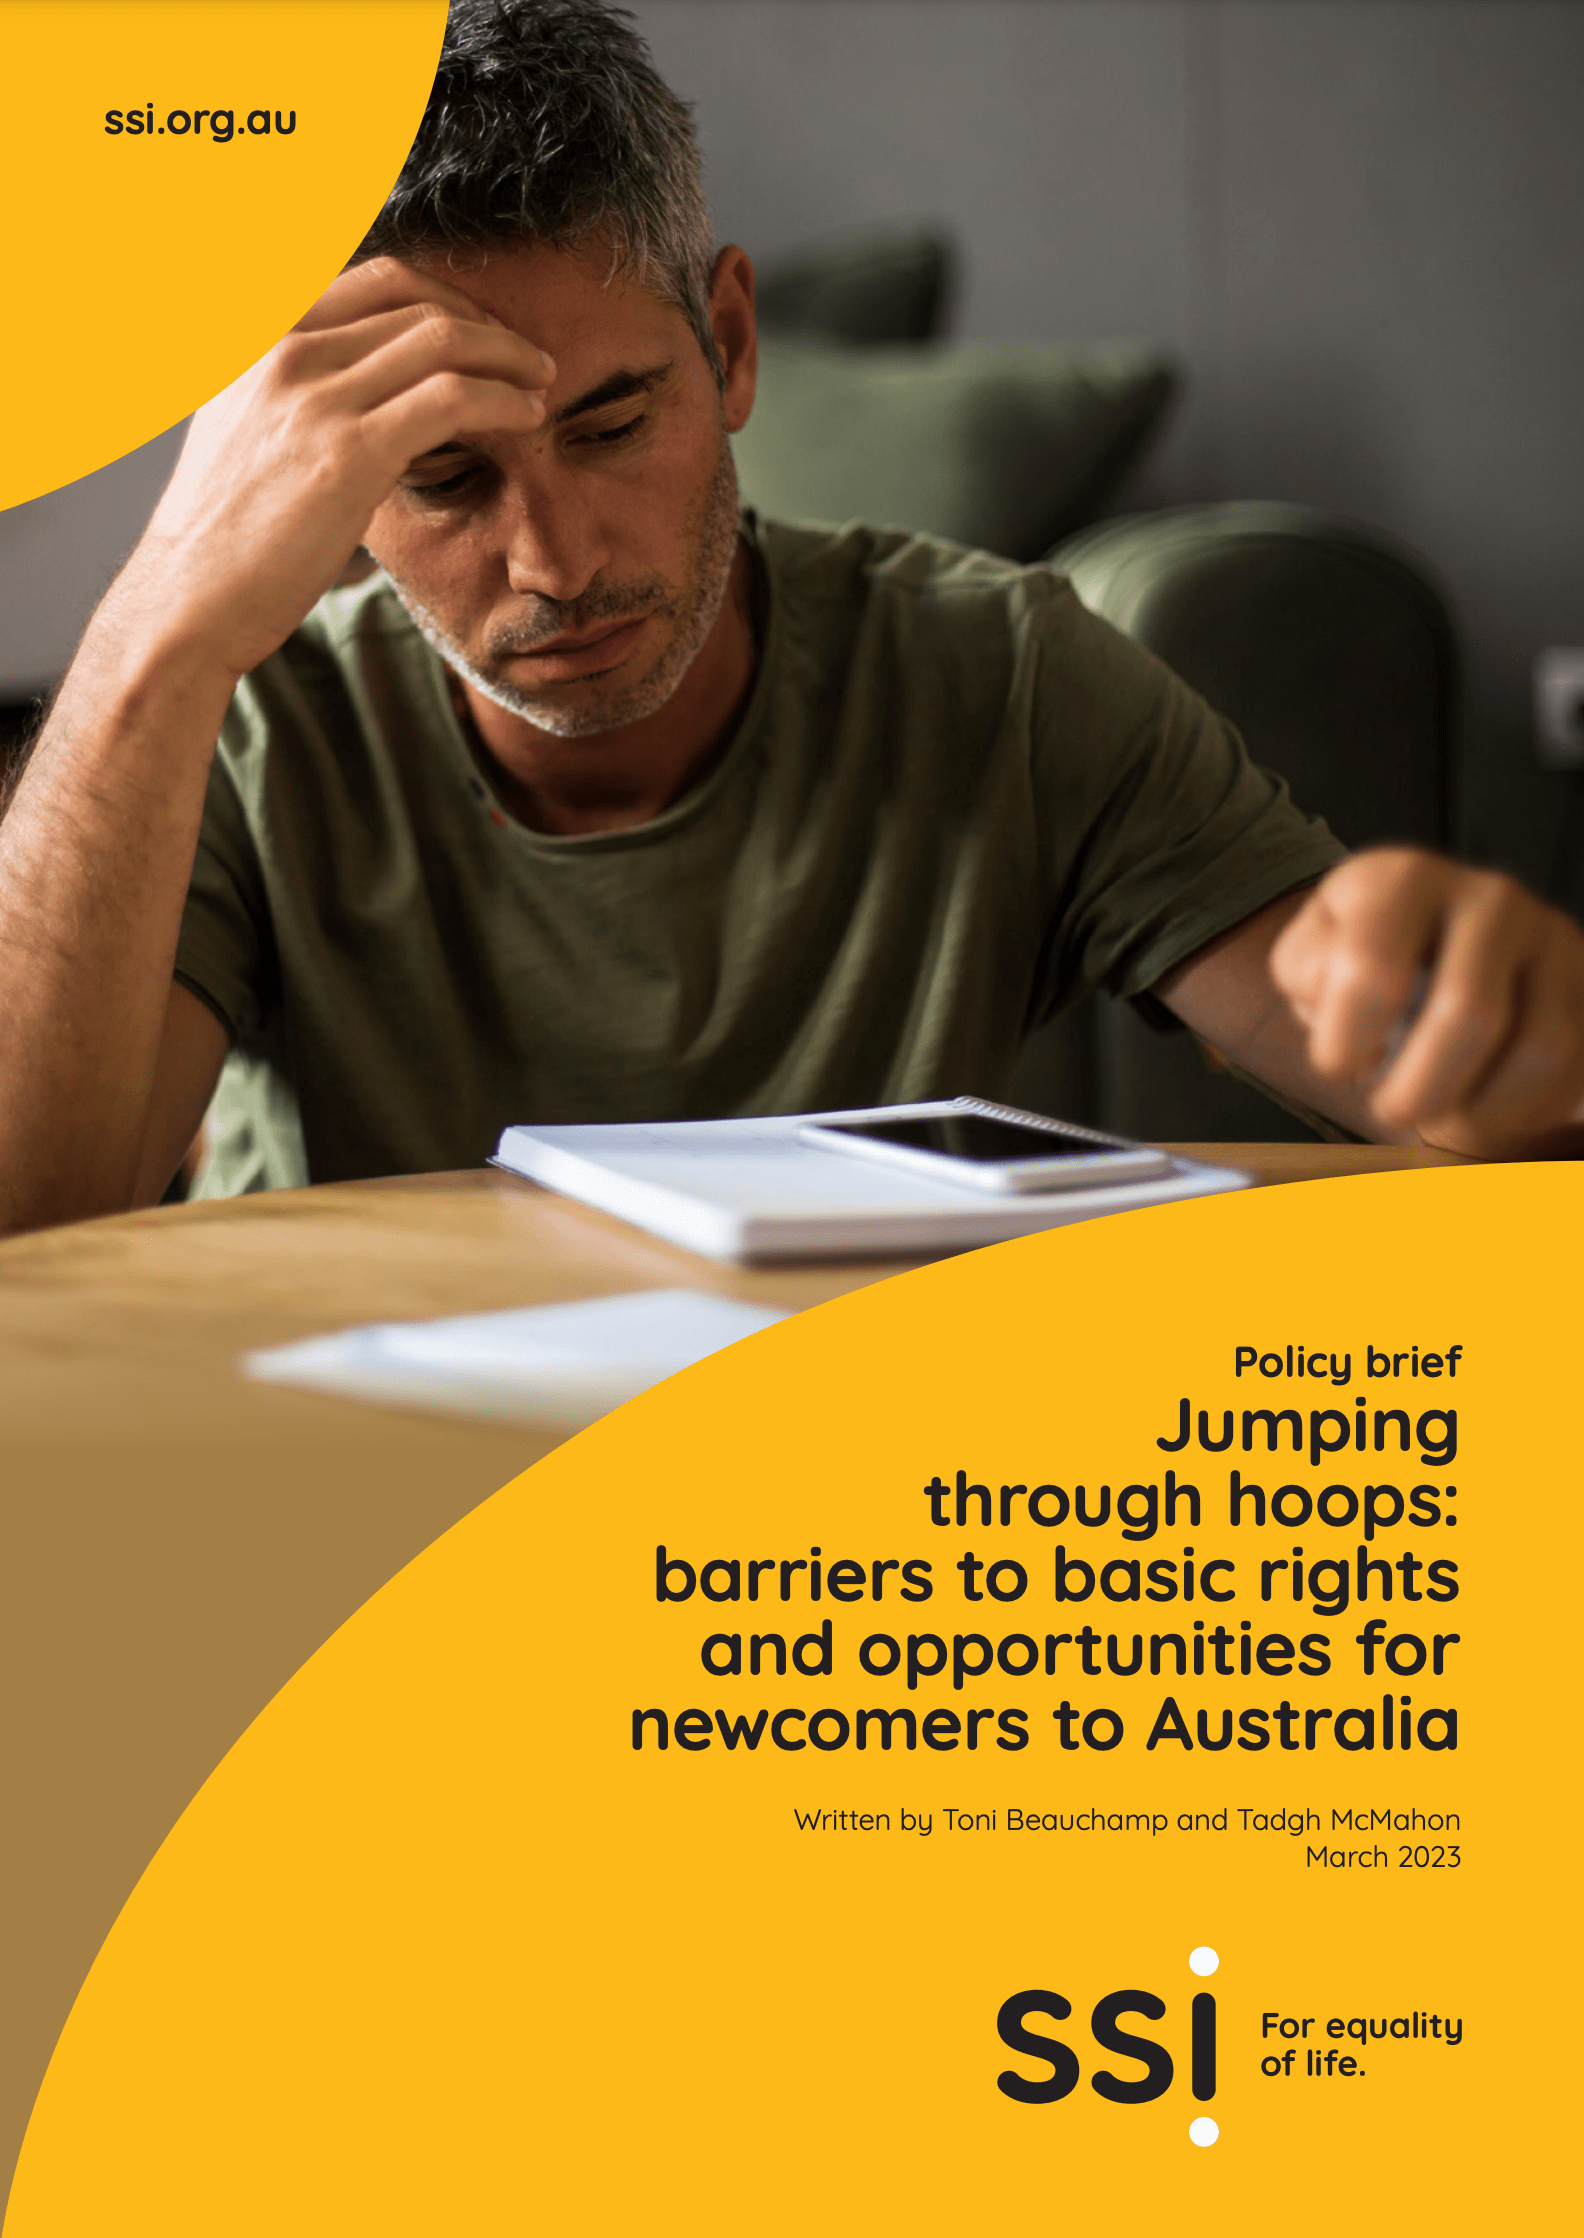
SSI’s Public Policy Agenda provides a foundation for SSI’s advocacy and a coherent set of asks that build on the strengths of SSI and our sector. Our Public Policy Agenda includes a series of Policy Briefs that spotlight and analyse key issues impacting the communities we serve and support engagement with decision-makers and sector stakeholders to drive systemic change.
We also make policy contributions through submissions that put forward recommendations to shape reforms.
Together, these interconnected streams of work strengthen our capacity to advocate effectively and drive meaningful change for the communities we serve.


Knowledge is a powerful tool to deepen understanding of the strengths and challenges that individuals and communities face and what’s needed to address barriers and overcome them.
SSI collaborates with researchers, governments, other organisations, and the broader community to conduct research on critical issues affecting the communities we work with and undertakes evaluations to assess the impact of programs that we deliver.
Our research initiatives aim to drive meaningful, lasting change to reduce inequality in Australia.
Research focus areas


SSI’s Public Policy Agenda provides a foundation for SSI’s advocacy and a coherent set of asks that build on the strengths of SSI and our sector.
Our Public Policy Agenda includes a series of Policy Briefs that spotlight and analyse key issues impacting the communities we serve and support engagement with decision-makers and sector stakeholders to drive systemic change.
Our Policy Briefs analyse critical issues and put forward recommendations to reduce inequality in Australia.
Download the Public Policy Agenda Overview.
Drawing on our expertise and experience working with communities, we engage constructively with government inquiries, legislative reforms, and policy consultations to advance positive social outcomes.
Our submissions on public policy issues reflect our commitment to evidence-based advocacy and systemic change.
Recent Policy Submissions
Submission on a Multicultural Act for Western Australia
Submission Inquiry into the value of skilled migration to Australia – December 2025
Submission to the Inquiry on Thriving Kids Initiative 2025
Submission on National Competition Policy Analysis 2025
Submissions on Australia’s Disability Strategy 2021-2031 Review
Submission on the Regional Migration Settings Discussion Paper
Submission to the Multicultural Framework Review
Submission on Draft National Strategy for the Care and Support Economy
Submission on Australia’s Humanitarian Program 2023-2024
Submission to the Join Standing Committee on Migration Inquiry
Submission on a Migration System for Australia’s Future
Submission on insights from the pandemic: Independent Inquiry on COVID-19
Submission to the Inquiry into Volunteering Queensland
Submission on Better and Fairer Schools (Funding and Reform) Bill 2024
Submission to the Productivity Commission Inquiry on Early Childhood Education and Care
Submission to the House Select Committee on Workforce Australia Employment Services
Submission on improving crisis communication to CALD communities